
Disclosure: This page contains affiliate links. If you buy through them, we may earn a commission at no extra cost to you. As an Amazon Associate I earn from qualifying purchases.
Quick answer
From May 2027, your AP Stats score comes from 42 multiple-choice questions (50%) and four free-response questions worth 10 points each (50%). The halves add up to a composite out of 100. Because 2027 is the first year of this format, every score estimate — including ours — is extra rough.
In this AP Stats grade calculator guide:
Written and reviewed by the PercentPilot Editorial Team · Updated 21 November 2026.
Key takeaways
- New for 2027: 42 MCQs with 4 answer choices (was 40 with 5) and 4 FRQs worth 10 points each (was 6).
- Each section is still 50% of the score.
- One FRQ point ≈ 1.25 composite points; one MCQ ≈ 1.19.
- 2026 (old format): 62% of students scored 3 or higher.
On this page
- How the AP Stats grade calculator works
- What changed in AP Statistics
- How to estimate your composite
- Methodology: how we built these estimates
- From a 3 to a 4: the per-step maths
- Estimated cut-offs (first year — use with care)
- 2026 results (old format)
- Calculator and formula sheet
- Confusion, cleared
- Common mistakes, and what to do instead
- Who should use this guide, and its limits
- Where you’ll use this
- Practice problems (with answers)
- Frequently asked questions
- Conclusion
- Sources
Most AP Stats grade calculator tools online still use the old six-question format. This guide uses the new May 2027 structure, so your estimate matches the exam you will take.
AP Stats Score Calculator (2027 format)42 MCQs + four 10-point FRQs.Open →How the AP Stats grade calculator works
An AP Stats grade calculator takes two inputs — your multiple-choice score out of 42 and your four free-response scores, each 0–10 — and turns them into one composite out of 100, which maps to an estimated AP score from 1 to 5. The same method powers the AP Stats Score Calculator.
Use it after a timed practice test in the new format, not an old six-FRQ test. The same method works for other AP exams — see the AP Lang score guide — and Khan Academy’s AP Statistics course covers the same five units.
What changed in AP Statistics
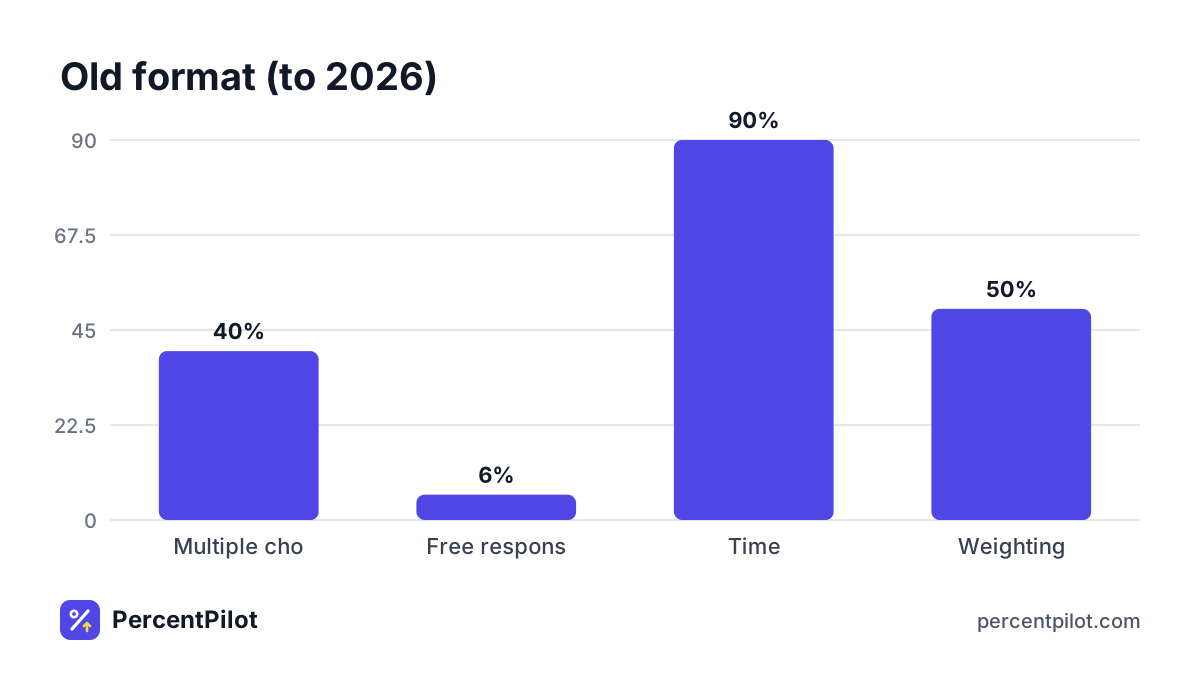
| Old format (to 2026) | New format (May 2027) | |
|---|---|---|
| Multiple choice | 40 questions, 5 choices | 42 questions, 4 choices |
| Free response | 6 questions (incl. investigative task) | 4 questions, 10 points each |
| Time | 90 + 90 min | 90 + 90 min |
| Weighting | 50% / 50% | 50% / 50% |
The course itself also changed: it now has five units instead of nine, and adds a new first practice, formulate questions.
How to estimate your composite
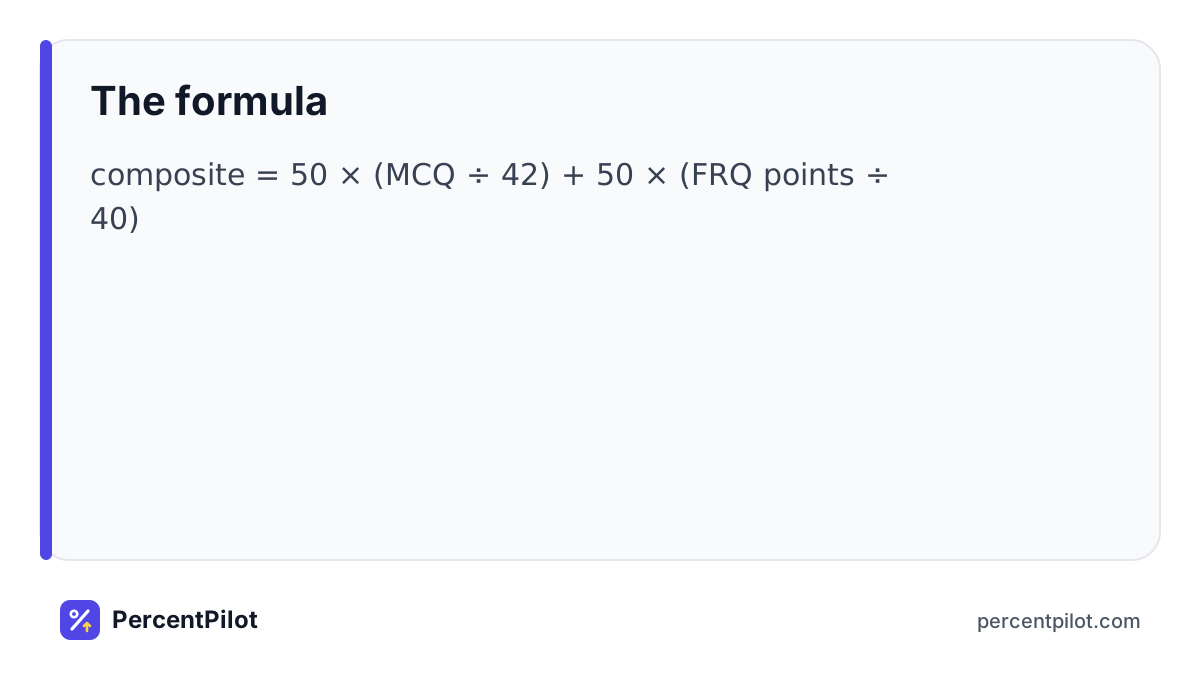
composite = 50 × (MCQ ÷ 42) + 50 × (FRQ points ÷ 40)
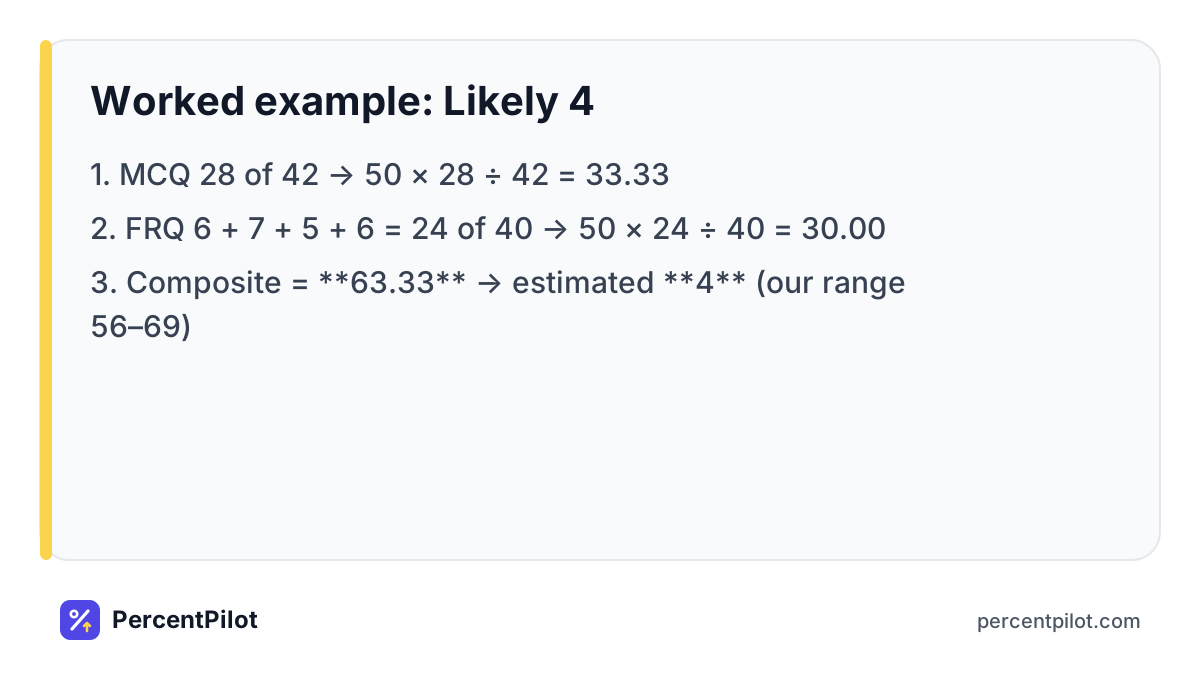
Worked example: Likely 4
- MCQ 28 of 42 → 50 × 28 ÷ 42 = 33.33
- FRQ 6 + 7 + 5 + 6 = 24 of 40 → 50 × 24 ÷ 40 = 30.00
- Composite = 63.33 → estimated 4 (our range 56–69)
Worked example: Near the 3 line
- MCQ 22 of 42 → 26.19
- FRQ 16 of 40 → 20.00
- Composite = 46.19 → estimated 3 (our line is about 43)
Methodology: how we built these estimates
Every figure in this guide comes from College Board: the AP Statistics revisions page (42 MCQs with four choices, four 10-point FRQs), the AP Statistics exam page, and the 2026 score distributions. The cut-offs are our estimates, built from the old-format distribution and the new composite maths — with no released data for the new format. College Board does not publish exact cut-offs.
We re-check this page when College Board publishes new distributions. Last updated 21 November 2026.
Expert review pending
No independent statistics educator has reviewed these first-year estimates yet; we will add their name and credential here when that review is complete.
From a 3 to a 4: the per-step maths
Take the worked example above: 22 MCQs and 16 FRQ points give 46.19 — a 3. The line for a 4 is about 56, so the gap is 9.81 points. One FRQ point is worth 1.25 and one MCQ 1.19, so the fastest route is through the FRQs:
| Step | Marks | Composite |
|---|---|---|
| Multiple choice | 22 of 42 | 26.19 |
| Free response | 16 of 40 | 20.00 |
| Composite | 46.19 → 3 | |
| + 8 FRQ points | 24 of 40 | 30.00 |
| New composite | 56.19 → 4 |
Worked example — eight more FRQ points is the smallest step across this line, worth more than eight more MCQs (9.52). Partial credit matters more than before: a complete answer with a small slip can still earn most of the points.
Estimated cut-offs (first year — use with care)
- 5: about 70+
- 4: about 56–69
- 3: about 43–55
- 2: about 32–42
- 1: below about 32
Accuracy first
With no released data for the new format, plan with the Strict curve. If the strict estimate is a 3, you have a safety margin.
2026 results (old format)
In 2026, 17% scored a 5, 23% a 4, 22% a 3, 17% a 2 and 21% a 1. Only 62% scored 3 or higher — one of the lower pass rates among large AP exams.
Calculator and formula sheet
A graphing calculator with statistics functions is expected on both sections, and formulas and tables are provided. The Bluebook app has a built-in graphing calculator; check College Board’s calculator policy if you bring your own.
Need your own handheld calculator? Browse graphing calculators on Amazon
What NOT to do
- Don’t practice only with old six-FRQ tests without adjusting the scoring to four 10-point questions.
- Don’t skip context in answers — AP Stats rubrics expect conclusions in context.
- Don’t leave multiple-choice questions blank; there is no guessing penalty.
More: how AP exams are scored, AP Bio score guide, and all AP calculators.
Confusion, cleared
Grade calculator vs score calculator
They are the same thing here. “Grade calculator” is the phrase students search for; “score calculator” is what the tool does — both return an estimated AP score from 1 to 5.
Composite points vs percentages
A 50% on the multiple-choice section is 25 composite points, not 50 — the section is worth 50 of the 100. One FRQ point (1.25) is worth slightly more than one MCQ (1.19).
Why 2026 results don’t set 2027 cut-offs
The 2026 results come from the old format — 40 MCQs with five choices and six FRQs — so the old distribution is a starting point, not a prediction. Our cut-offs are first-year estimates; check your school or College Board for the official word.
Common mistakes, and what to do instead
Three mistakes show up again and again. First, practising only with old six-FRQ tests without rescoring them to four 10-point questions — your composite will be wrong before you start. Second, skipping context: AP Stats rubrics expect conclusions in context. Third, leaving MCQs blank: there is no guessing penalty, so answer every question.
Fix the biggest leak first: for most students it is the FRQ conclusions. State the conditions, show the test statistic, and give the conclusion in context — that is worth more than any other single change.
Who should use this guide, and its limits
Who should use it
AP Statistics students with timed practice scores in the new format, teachers checking a class’s spread, and parents helping a student plan.
Where it falls short
Three honest limits. The cut-offs are first-year estimates — no released data exists for the new format. FRQ self-scoring is unreliable, so an estimate built on guessed FRQ scores can be off by a full grade. And we have not verified this against every teacher’s rubric. Always confirm a borderline result with your teacher.
Where you’ll use this
Your class takes its first practice test in the new format. You get 30 of 42 on the multiple choice and 7, 6, 5 and 4 on the four 10-point free-response questions. Composite: 50 × 30 ÷ 42 = 35.71 plus 50 × 22 ÷ 40 = 27.50, for 63.21 — an estimated 4.
Because each FRQ is now worth 10 points, partial credit matters more than before. A complete answer that states the conditions, shows the test statistic and gives a conclusion in context can earn most of the points even with a small arithmetic slip. When you review, score each part of the rubric separately so you see exactly which skill — collecting data, analyzing, or drawing conclusions — costs you the most.
Practice problems (with answers)
Try each one, then check it with the AP Stats Score Calculator (2027 format). More tools: all AP & IB score calculators.
- Estimate the score: Multiple choice 34; Free response 29 (8 + 7 + 8 + 6). Answer: Multiple choice: 34/42 × 50 = 40.48 · Free response: 29/40 × 50 = 36.25 → composite 76.73 → estimated 5.
- Estimate the score: Multiple choice 26; Free response 20 (5 + 6 + 5 + 4). Answer: Multiple choice: 26/42 × 50 = 30.95 · Free response: 20/40 × 50 = 25 → composite 55.95 → estimated 3.
- Estimate the score: Multiple choice 18; Free response 14 (4 + 3 + 4 + 3). Answer: Multiple choice: 18/42 × 50 = 21.43 · Free response: 14/40 × 50 = 17.5 → composite 38.93 → estimated 2.
Frequently asked questions
Is the AP Statistics exam changing in 2027?
Yes. From May 2027 it has 42 multiple-choice questions with four choices and four 10-point free-response questions.
Is the investigative task gone?
It is no longer a separate Part B question. The new section has four 10-point questions.
What is a passing AP Stats score?
A 3 or higher. In 2026, 62% of students reached it.
What is a good AP Stats score?
A 4 or 5 earns college credit at most US colleges, and a 3 earns credit at many. Each college sets its own minimum — check its AP credit policy.
Can I get a 5 with weak FRQs?
Almost certainly not. The FRQs are 50% of the score: even with all 42 MCQs right, FRQ scores of 3, 3, 3 and 3 give 50 + 15.00 = 65.00 — a 4, not a 5.
Is AP Stats curved?
Not in the usual sense. College Board sets the 1–5 cut-offs each year after scoring, using standard-setting — so they move a little from year to year, and ours are first-year estimates.
How do I use the AP Stats grade calculator?
Enter your multiple-choice score out of 42 and your four FRQ scores, each 0–10. The calculator builds your composite out of 100 and shows your estimated AP score.
Conclusion
The AP Stats grade calculator is simple once the new weights are clear: 42 multiple-choice questions at 50%, four 10-point FRQs at 50%, one composite out of 100. About 43 is a 3, 56 a 4 and 70 a 5 on our first-year estimate — and because one FRQ point is worth slightly more than one MCQ, the FRQs are where the score moves. Take a timed practice test in the new format and work on the part of the rubric that cost you the most.
Try it now
Put your own numbers into the AP Stats Score Calculator — 42 MCQs and four 10-point FRQs — and see your estimated score in seconds. PercentPilot is free, no signup, no login.
Sources
- College Board – AP Statistics revisions
- College Board – AP Statistics exam
- College Board – AP score distributions 2026
- College Board – AP calculator policy
Spotted an error? Tell us and we will fix it and note the change here.